z.tvrnr_
The Great Canadian Death Tally – Infographic Development
October – December 2021
Description_
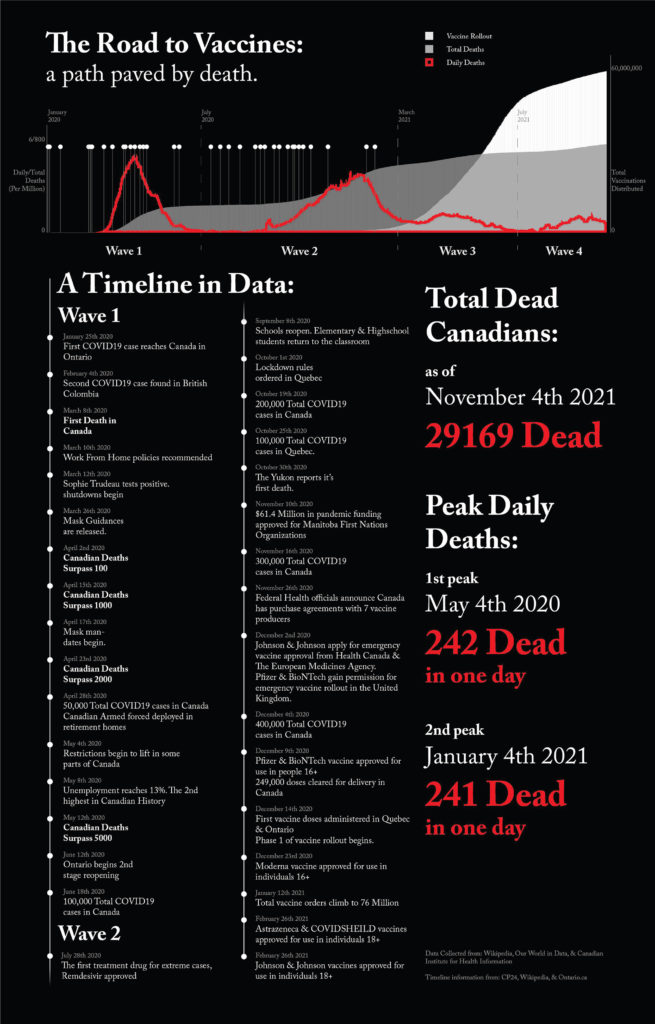
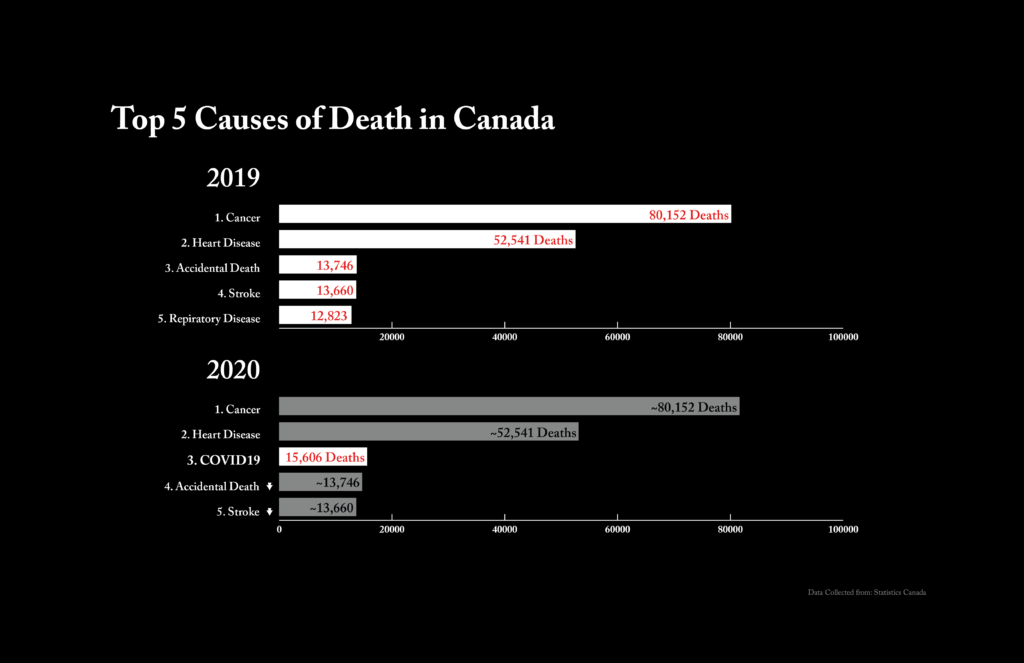
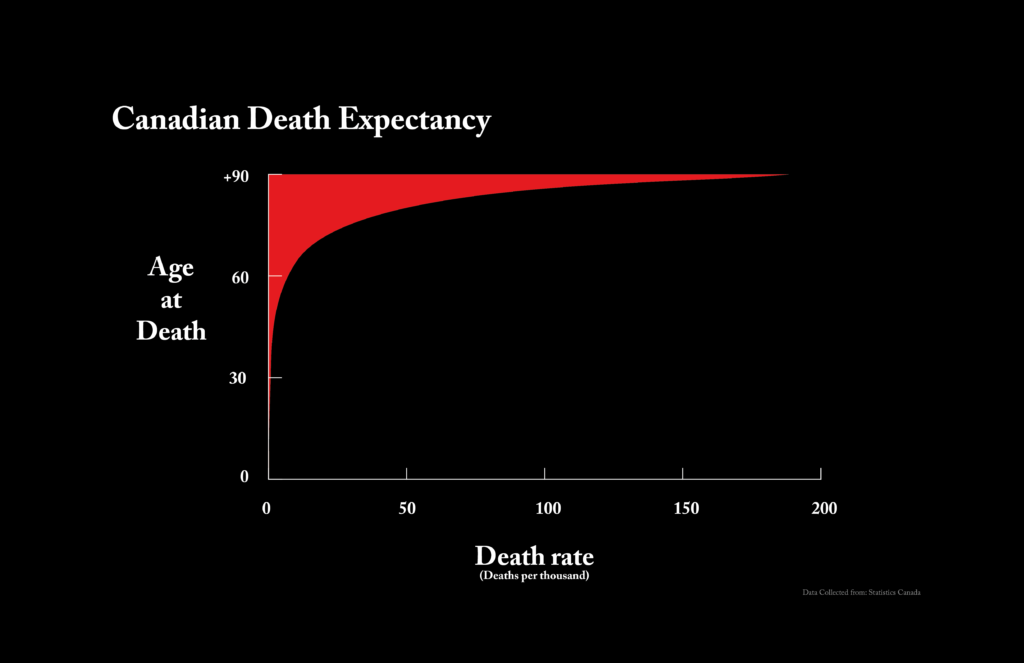
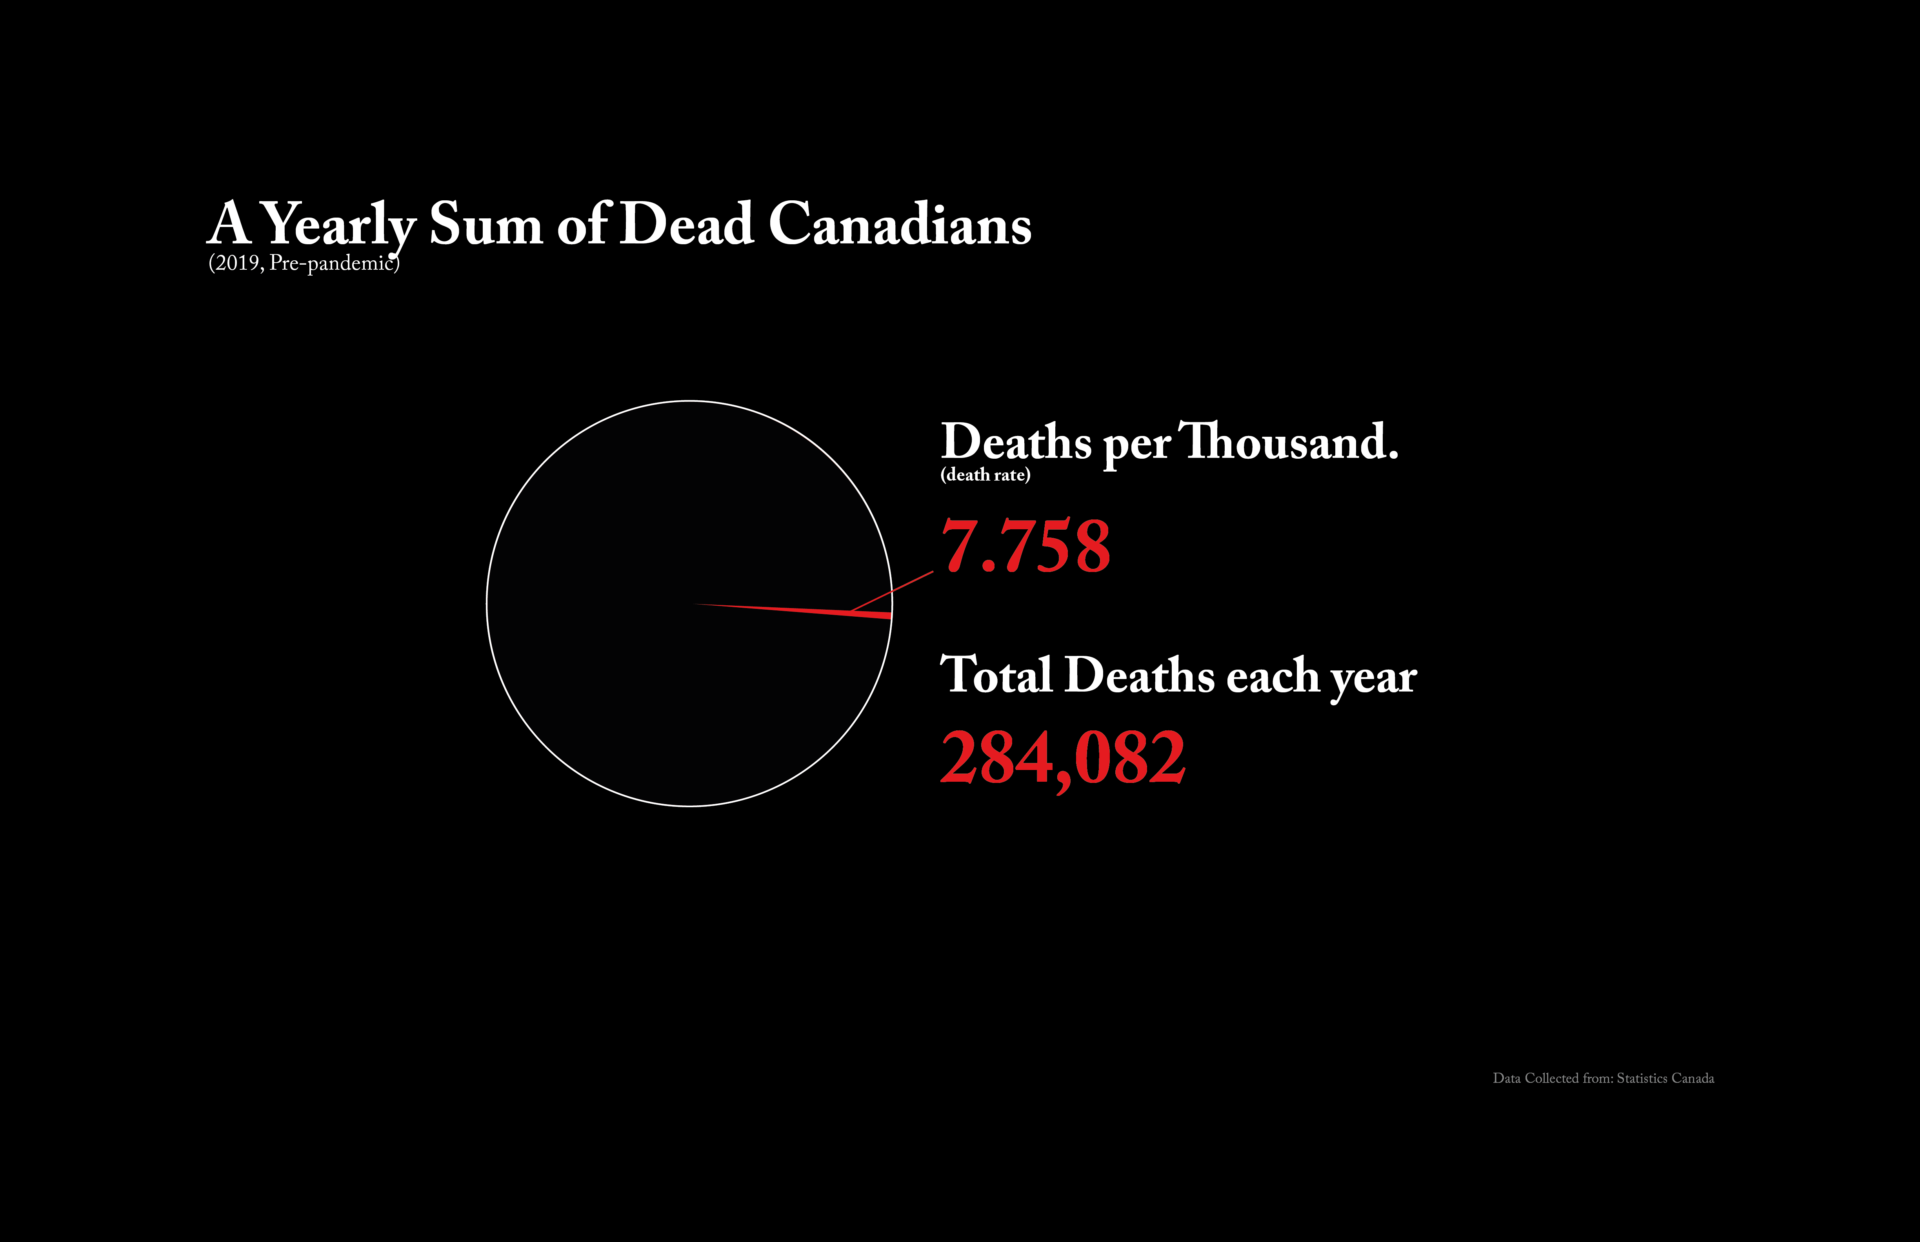
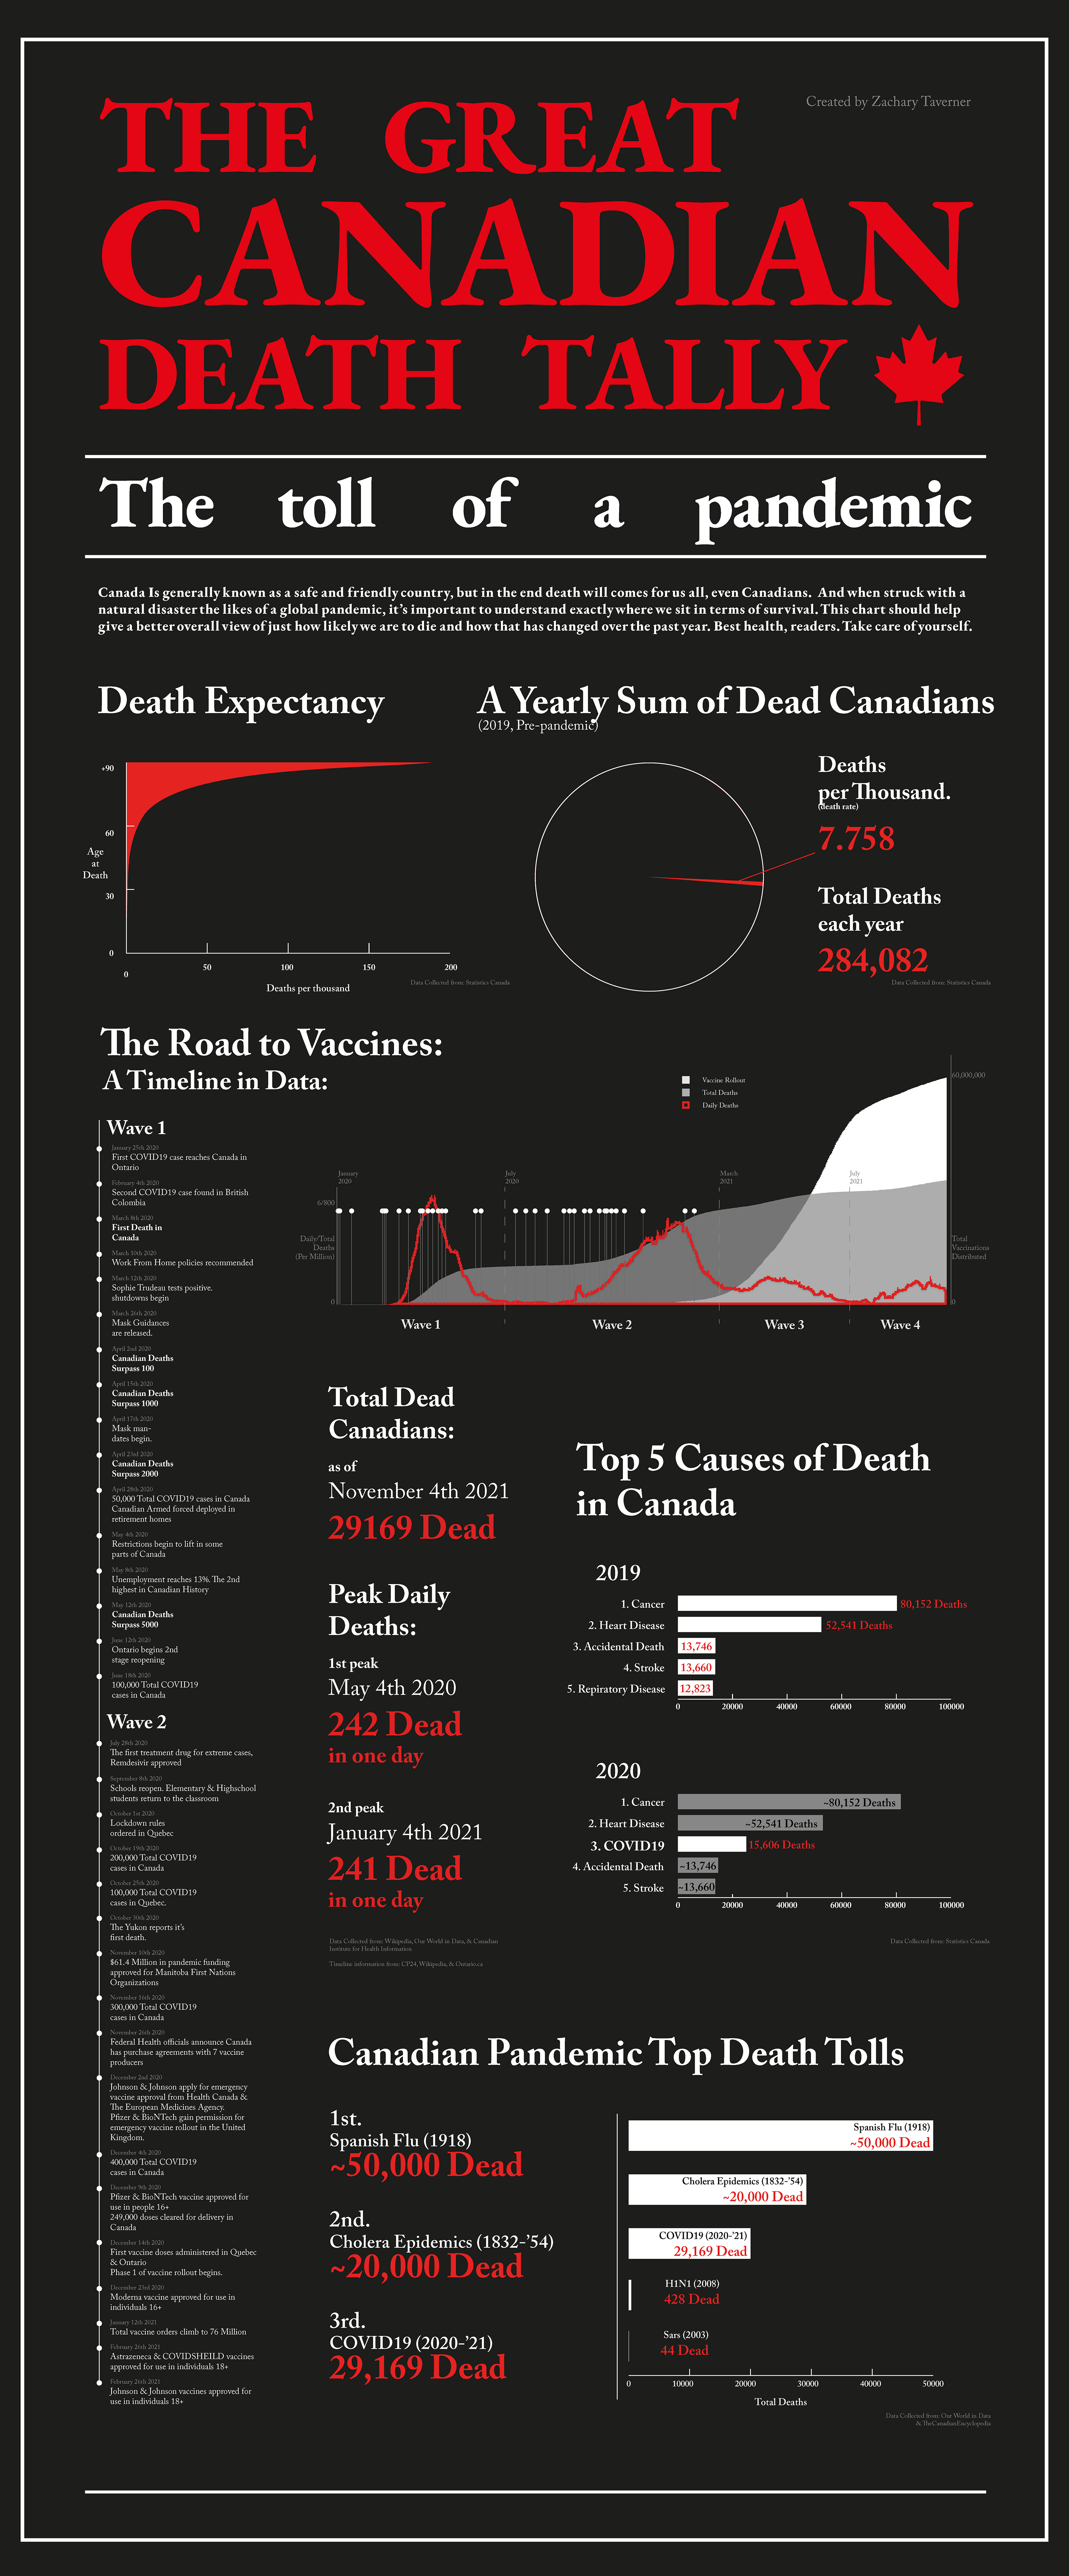
The Great Canadian Death Tally was an infographic developed over the course of a series of college projects, culminating in the assembly of the final graphic seen above. The constituent projects of the piece involved doing research and gathering related data from reliable sources in order to create data visualizations and form a narrative, as well as to develop a timeline or otherwise temporal graphic.
The narrative of my piece
Inspiration_
_Macabre fascination
_Covid activism
_Data visualization
Challenges_
_Layout / Narrative Structure
_Data Arrangement / Consistency
_Graphic Design
Process_
_Concept Development
_Topic Research
_Data Collection / Pruning
_Data Visualization Development
_Full Infographic Construction
Design Tool Used_
_Microsoft Excel
_Adobe Illustrator
Fonts Used_
_Adobe Caslon Pro
_EB Garamond ExtraBold (Title)